Section 6 Data exploration
6.1 Listing unique values in a column
The List Unique values algorithm, from the Processing Toolbox, generates a table and a HTLM report of the unique values of a given layer’s field.
To illustrate the use of the List Unique values algorithm, we will import the grandparcs.kml file. The field Generique2 stores the type of parks located in Montreal, and we would like to know the unique values without having to open the attribute table.
Launch the List Unique values algorithm from the Processing Toolbox. It will identify the available layer in the current project.
Click on … from the Target Field(s) and select Generique2. Click on Run to generate a temporary layer and a HTLM report.
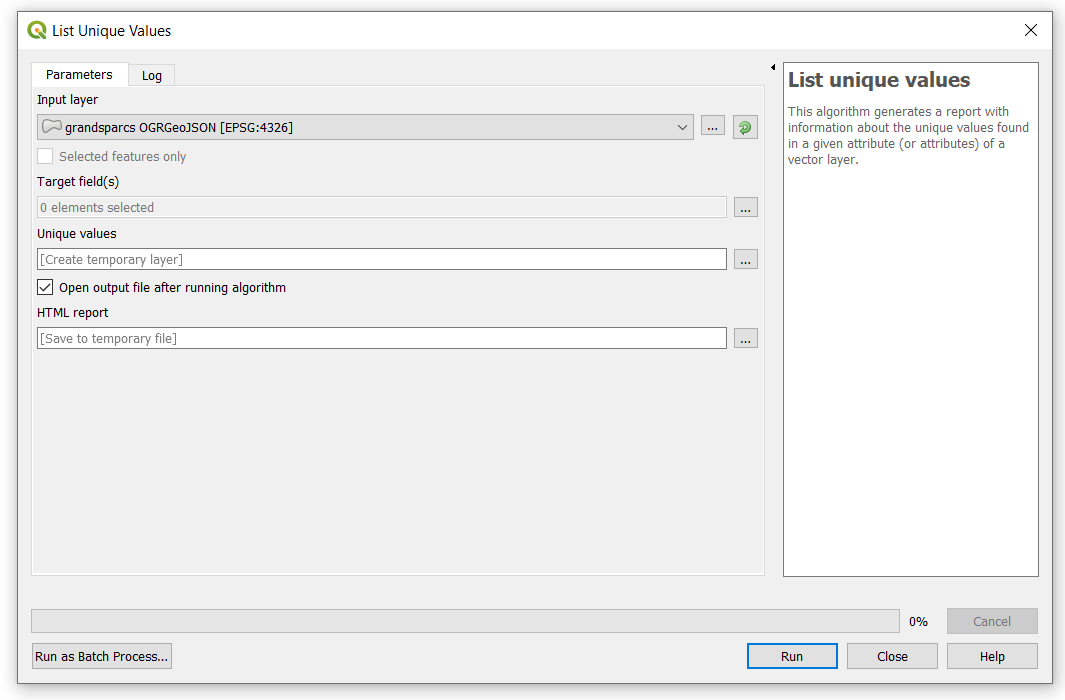
Figure 6.1: List unique values window
6.2 Loading BaseMaps
When we import layers into QGIS, sometimes it is difficult to identify what the points, lines or polygons of a layer correspond to. In these situations, it is very helpful to add a base map to give some spatial context.
One plugging that comes in hand to add spatial context is QuickMapServices. If it is not already available in your QGIS Desktop, navigate to Plugins, then to Manage and Install Plugins. In the window that has been displayed search QuickMapServices and click on Install Plugin.
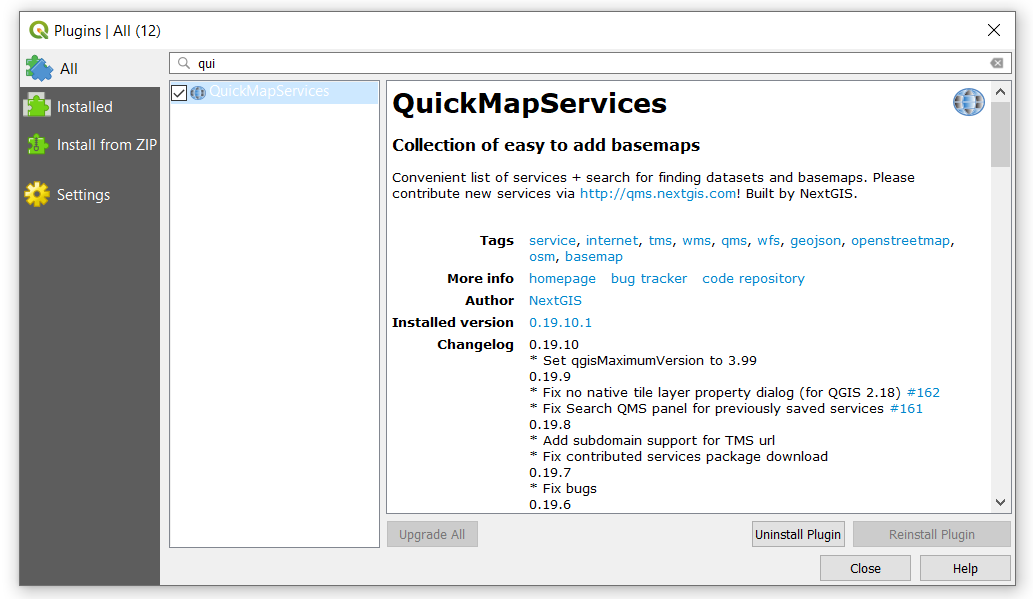
Figure 6.2: Manage and install plugins in QGIS
To illustrate the use of QuickMapServices, load the stations_rsqa_12_31_2013.shp. Navigate to Web from the menu bar, select QuickMapServices, go to OSM, and select OSM_Standard. You will see the following set of air quality monitoring stations located in Montreal.
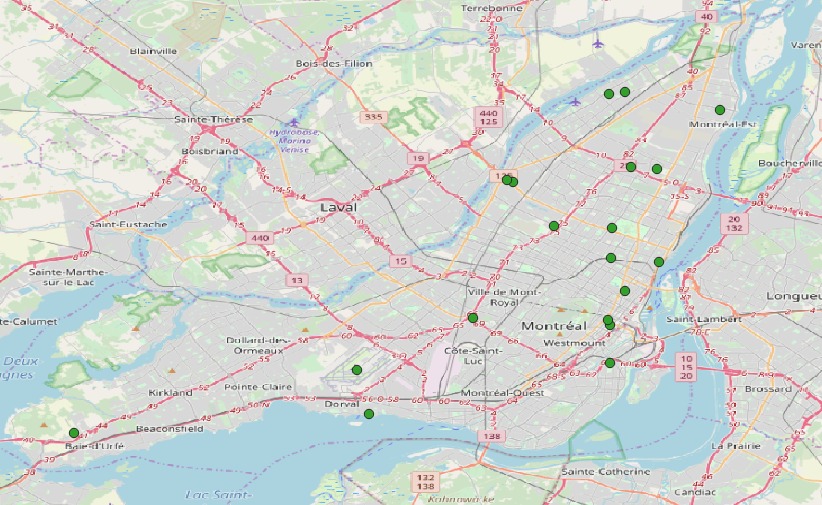
Figure 6.3: Montreal’s Air Quality Monitoring Network