Section 3 Loading and Exporting data
The quickest way to load data into QGIS is the technique drag-and-drop. It only requires locating the data you want to import into QGIS, select the file, and drop it on the Map display or on the layer panel.
Another option for importing data is to use the browser panel. Navigate through the browser, locate the layer or data to be imported, right-click on it, and finally select Add Layer to Project. However, using the Manage Layers Toolbar or Add Layer from the Layer menu give more control on the importation.
3.1 Importing data from text files
This recipe is illustrated with the coordonnees-stations-rsqa.csv file, which reports the locations of the stations of the Air Quality Monitoring Network (RSQA) set up in Montreal. The aim of the RSQA is to monitor the atmospheric concentration of criteria pollutants.
- Navigate to the Layer menu and select Add delimited text layer. The following dialog will pop up:
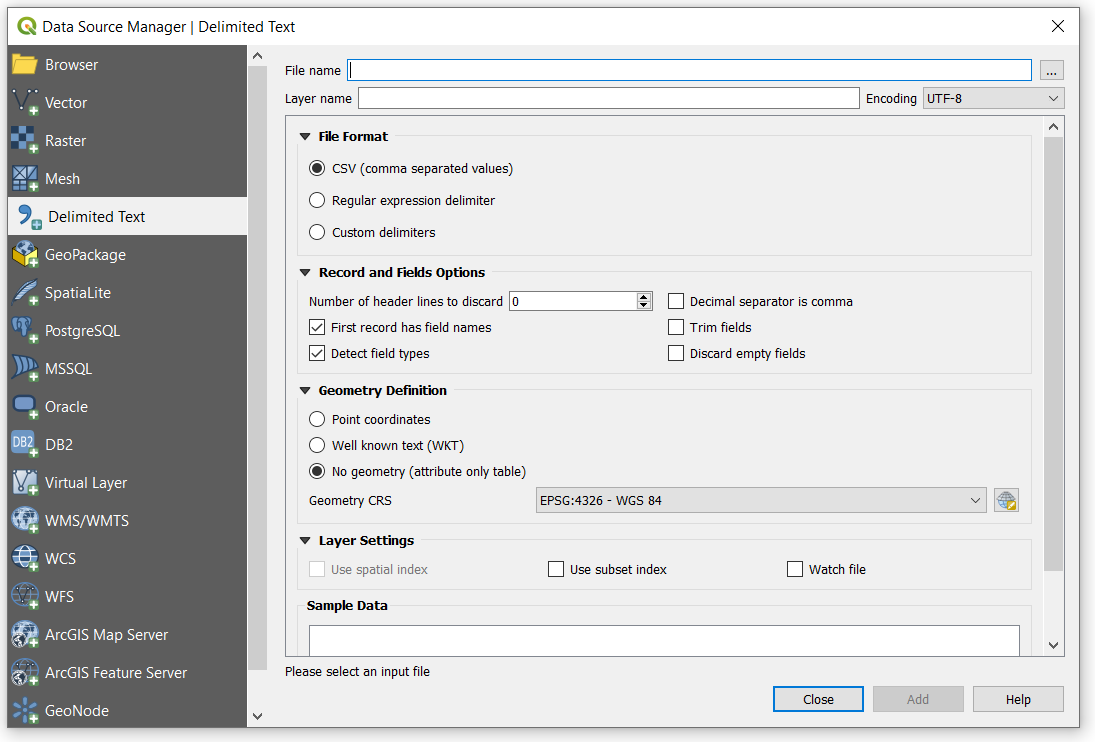
Figure 3.1: Add delimited text layer window
- In the File Name field, indicate the path to the
coordonnees-stations-rsqa.csvfile.
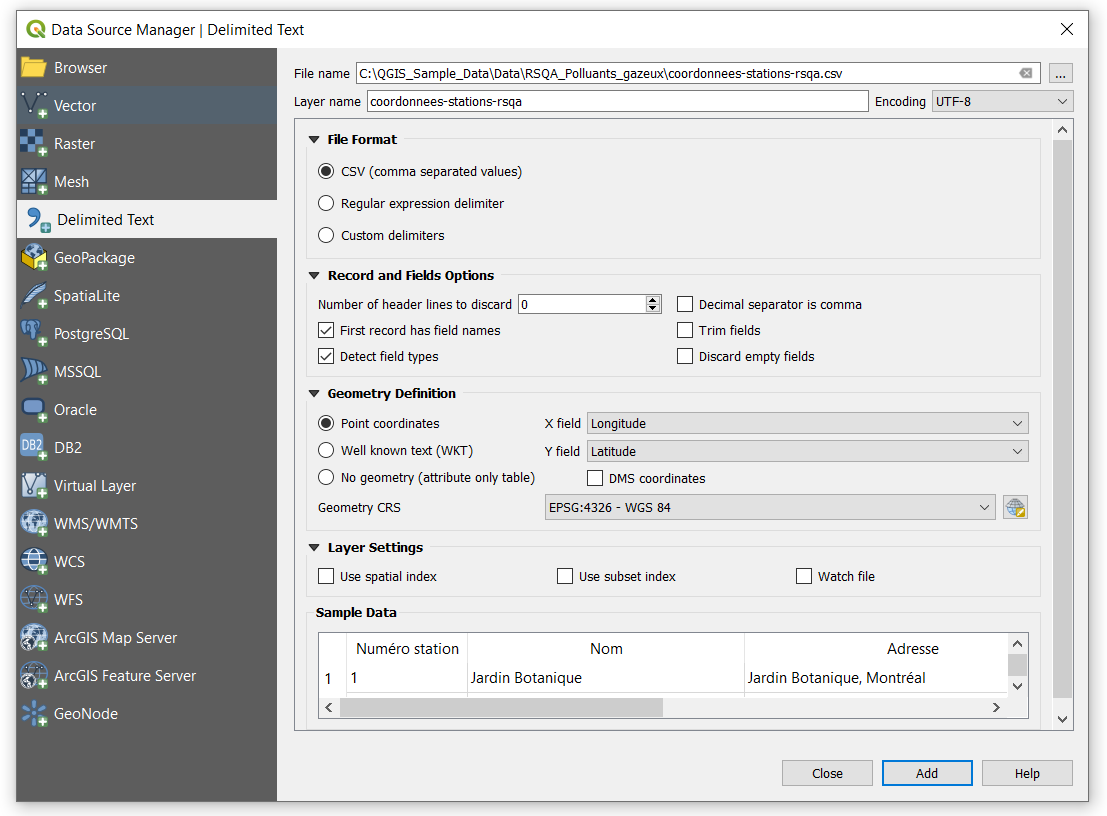
Figure 3.2: Indicating the path to the text file
In the Geometry Definition section, indicate that point coordinates are being imported. Then indicate the corresponding fields for longitude and latitude. According to the sources of the layer being imported, the coordinate system is WGS 84, so we don’t need to change it. When you want to import an attribute table, you can select the option No geometry.
Click on Add. You will see the following set of points, probably not in the same colour. Optionally, you can add a base map or another layer to give some spatial context, but for now we have successfully imported the layer corresponding to the stations of the RSQA network.
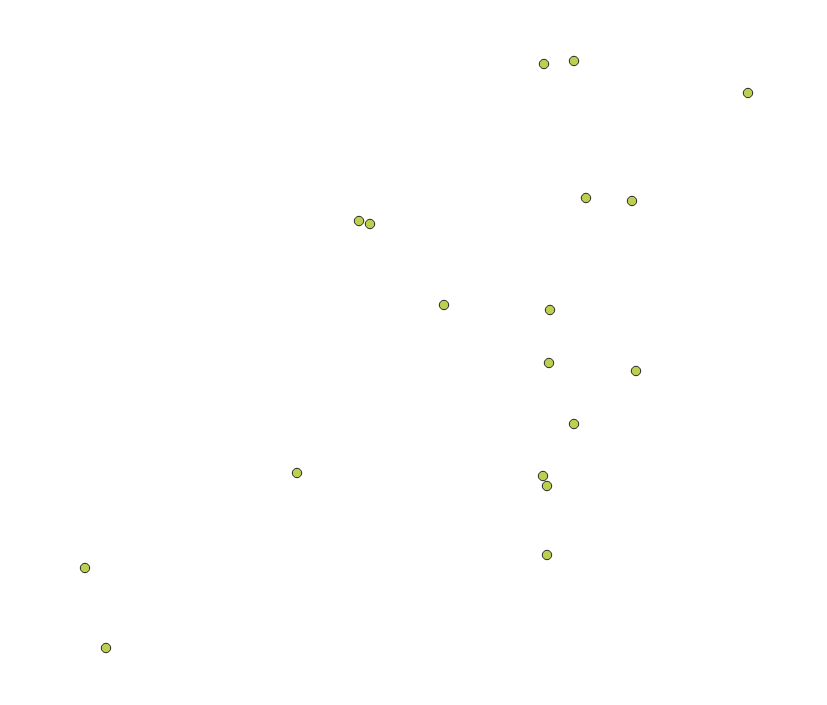
Figure 3.3: Montreal’s Air Quality Monitoring Network
In section 6.2 we describe how to add a basemap to add spatial context.
- Optional step: save the imported layer as a new shapefile (Section 3.4).
3.2 Importing data from KML files
QGIS supports importing Keyhole Markup Language (KML) files. KML is the format used by Google Earth to show spatial data.
The importation of a KML is illustrated with the grandparcs.kml file which contains polygons corresponding to the parks of Montreal.
- Navigate to the Layer menu and select Add vector layer. The following dialog will pop up:
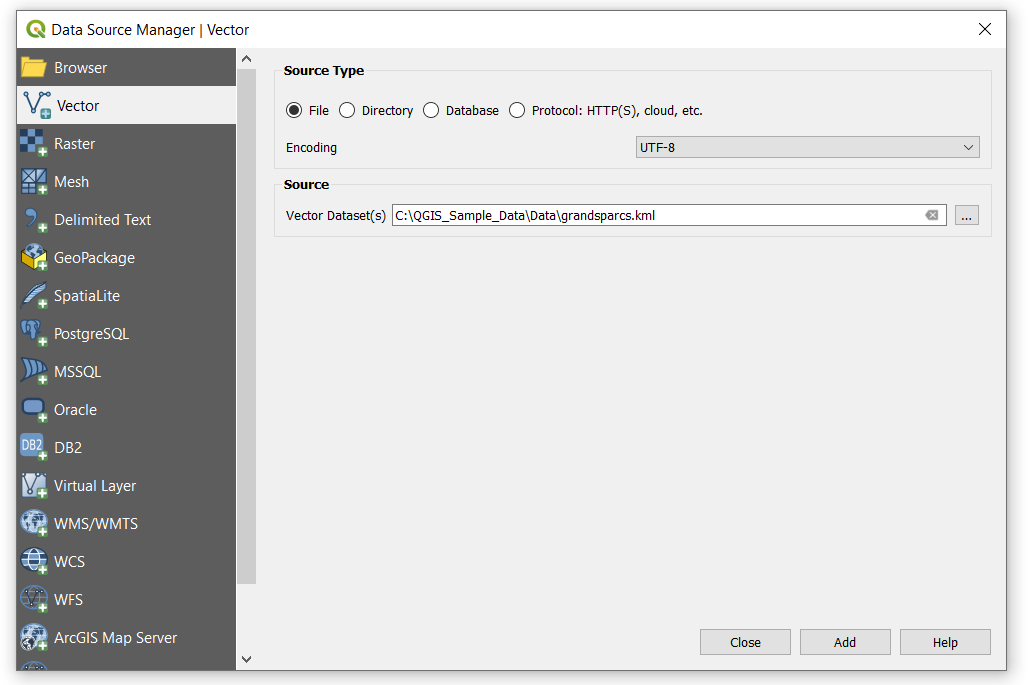
Figure 3.4: Add vector layer window
- In the File Name field, indicate the path to the
grandparcs.kmlfile. The following layer will be displayed in QGIS:
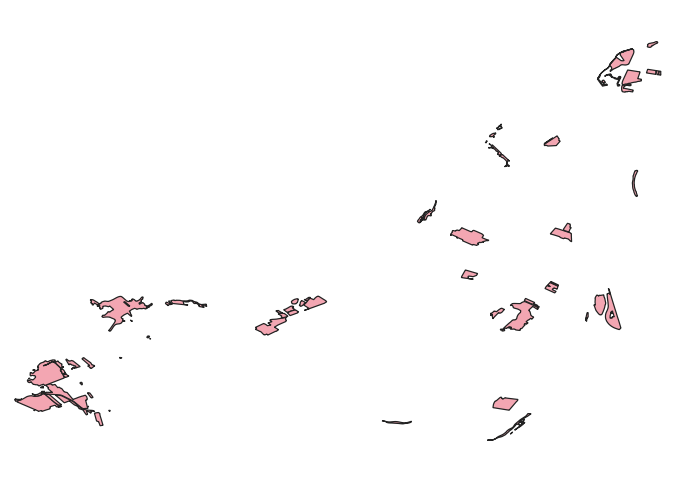
Figure 3.5: Montreal’s parks
3.3 Importing GeoJSON files
GeoJSON is another frequently used format for storing and representing geographical attributes. This format is based on the JavaScript Object Notation (JSON).
The importation of a GeoJSON layer is illustrated with the ilotschaleur.json file. This file contains the urban heat islands (UHI) of Montreal. UHI correspond to urban areas characterized by higher summer temperatures than the immediate environment with differences between 5 and 10°C.
- Navigate to the Layer menu and select Add vector layer. The following dialog will pop up:
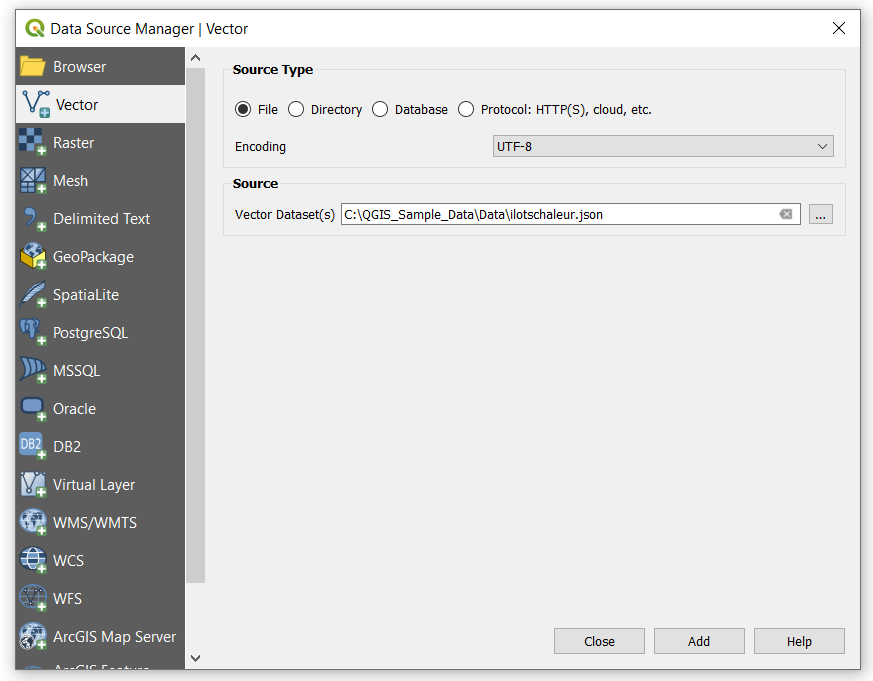
Figure 3.6: Add vector layer window
- In the File Name field, indicate the path to the
ilotschaleur.jsonfile. The following layer will be displayed in QGIS:
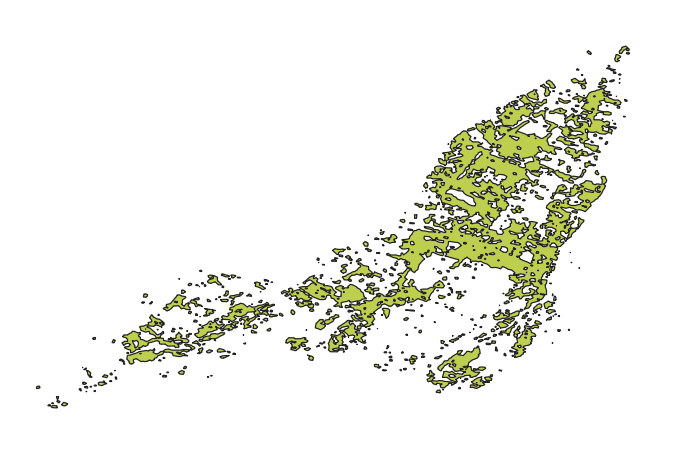
Figure 3.7: Urban heat islands (UHI) of Montreal
3.4 Saving a layer
We use the previously imported coordonnees-stations-rsqa.csv file to illustrate how to export a layer in a different format.
- Right-click on the name of the layer, select Export, then Save features As… The following dialog window will pop up.
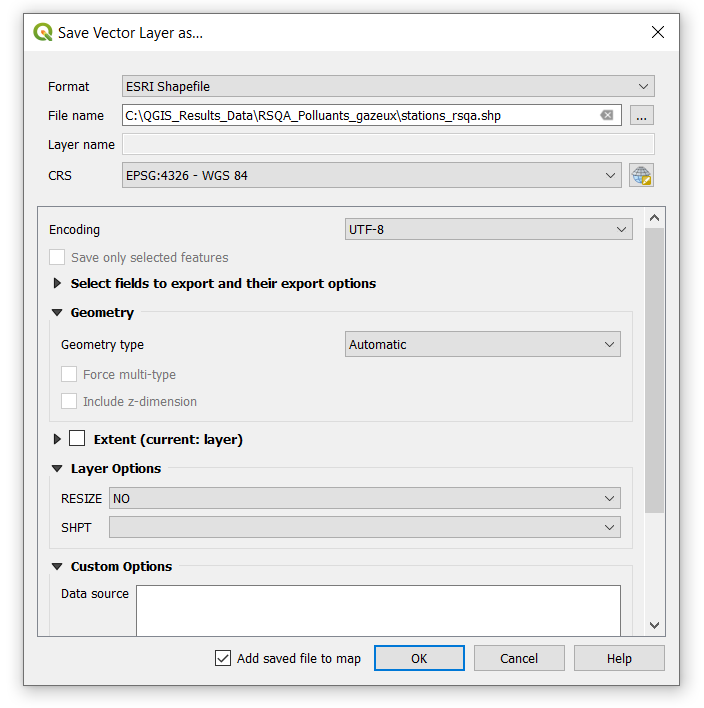
Figure 3.8: Save features as… window
Select the format in which you want to export the layer. In this case, we have selected the widely used ESRI shapefile, we will use this layer in future recipes. Another commonly used format is GeoJson since it is compatible with web base applications.
Indicate the path where the layer will be stored and give it a name. Indicate whether you want to add the saved file to the current project, and finally click on OK.
3.5 Reprojecting a layer
Most of the time, the layers are not in a CRS that is more convenient for the operation in hand. QGIS offers on-the-fly reprojections for rendering the layers. However, when executing operations like spatial analysis, it is required that all layers be in the same CRS. This recipe is illustrated with the LIMADMIN.shp file that corresponds to the administrative limits of Montreal’s boroughs.
Before executing a spatial analysis, it is recommended to reproject the layers to the most convenient CRS.
- Right-click on the name of the layer, select Export, then Save features As…. The following dialog window will pop up.
- Indicate the path where the layer will be stored and give it a name. If you tick the box Add saved file to map, the recently exported layer will be saved and added to the current project.
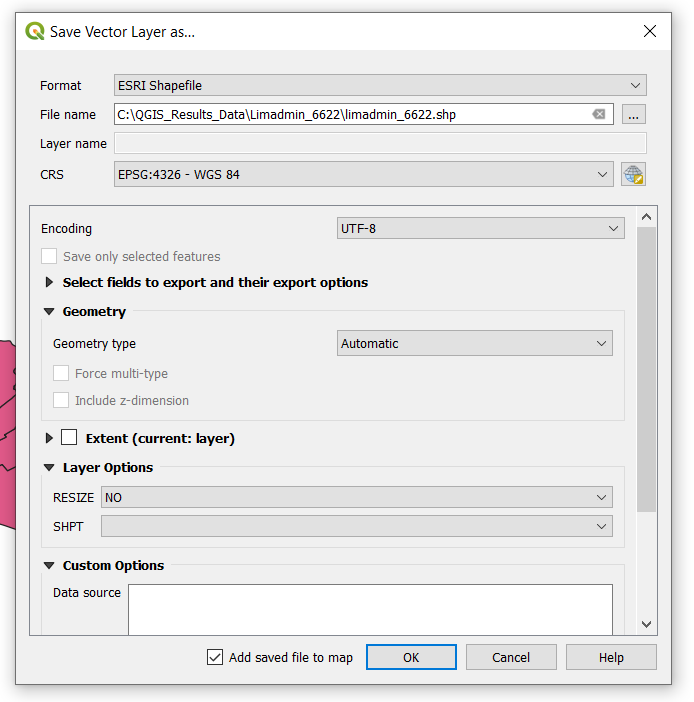
Figure 3.9: Reprojecting a layer
- Click on the little globe to select the CRS in which the new layer will be projected. The following window will pop up:
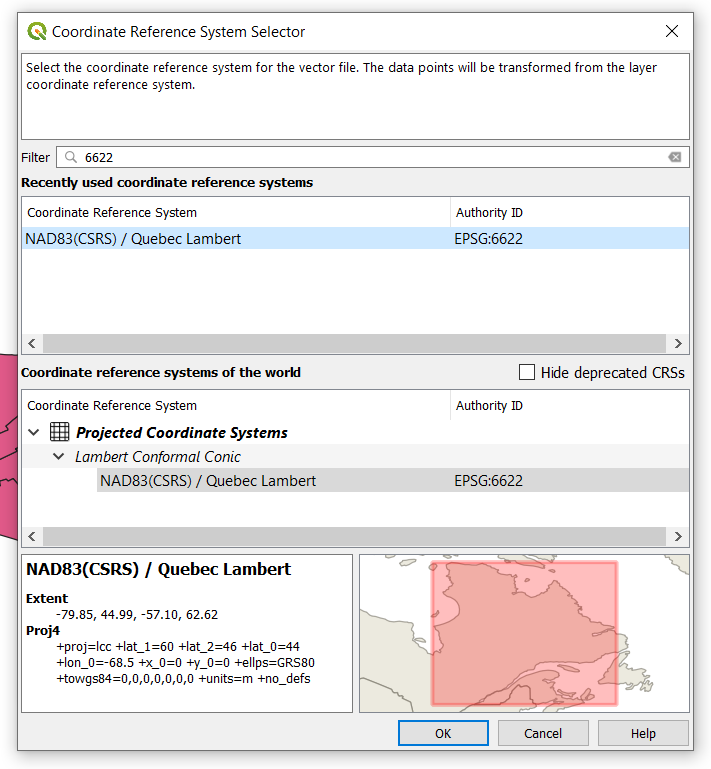
Figure 3.10: Selecting another CRS
- You can filter the CRS. In this case we will export the new layer in EPSG:6622, since it is the most accurate for Quebec. Click OK to confirm the selection of the CRS and click again OK to save the layer.